
DC Atlas Plus is an online mapping tool that contains over
340 different data layers, organized by category. DC Atlas Plus is the updated
version of DC Atlas, which was created by OCTO GIS, as an easy way to view
geographic information about the District of Columbia. http://atlasplus.dcgis.dc.gov/
Contents
Main Menu
![]()
The main menu allows you to
select from a variety of mapping tools.
��
Navigation
��
Layers
��
Property
Search
��
Tools
��
Identification
��
Popular Maps
��
Clear
Selection
��
Clear Map
��
Help
��
Full Screen
Each tool is described in detail
in this document.
Navigation
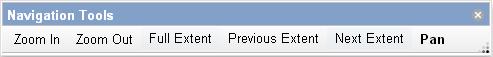
The navigation tools allow you to
move around the DC Atlas Plus map.
Zoom in �C After activating the
Zoom In tool by clicking on it, left-click and drag the mouse to create a box
around the area of interest. The
map display will zoom in to that area.
Zoom out �C After activating the Zoom
In tool by clicking on it, left-click and drag the mouse to create a box around
the area that will become the center of the map. The map display will zoom out to that
area.
Pan (the display) �C Left-click
and drag the mouse to move the display in the desired direction. Release the mouse button at a location
to center the display at that location.
Full extent
�C Click the Full Extent button to return to the boundary of the District of
Columbia.
Previous
extent �C Click the previous extent button to return to the previous extent
displayed on the map.
Next Extent - Click the Next
Extent button to return to the previous extent displayed on the map.
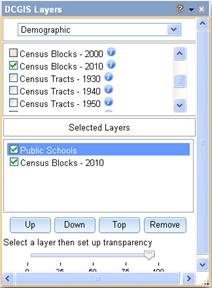
Layers
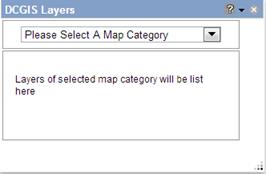
To add data layers to your map,
you will select a layer from the drop down list of categories. Data layers are
organized into categories to make finding the correct layer easier.
Select a category from the drop
down to view layers within the category.
Tick the box next to each map layer that you wish to add to your
map.
Use the Up, Down, and Top buttons to move the
layers into your desired order. The layers will draw on the map in the same
order they show in the Layers Tool.
Use the Remove button to remove unwanted layers from the list. Highlight the unwanted layer, then click Remove
to remove the layer.
The transparency tool allows you
to make an individual layer more or less transparent. Click on a layer to select it. Move the slider from 100% (completely
opaque) to 0% (completely transparent) to adjust the transparency. 40% is a good amount of transparency to
be able to see the layer and what is underneath.
Property Search
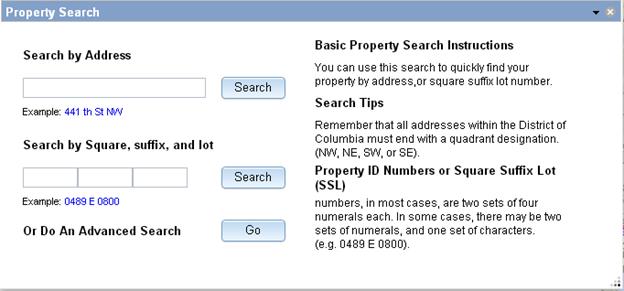
Tools
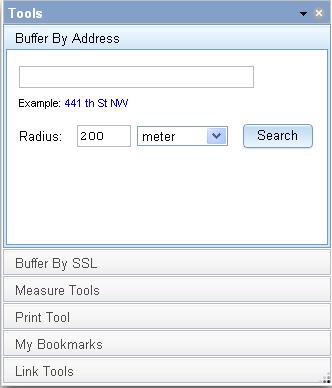
Buffer by Location
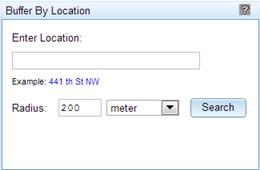
In the box that says Enter Location, type in the address,
intersection, or block location you would like to buffer.
Choose your buffer radius by
typing in a distance measurement and selecting a unit of measurement.
Click Search
The map display will zoom to the
selected location and create the desired buffer around the location.

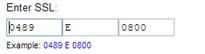 Buffer by Square,
Suffix, Lot
Buffer by Square,
Suffix, Lot
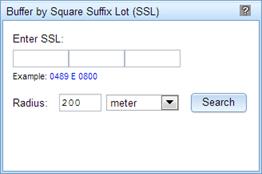
Enter the Square Suffix and Lot
number for the property location you would like to buffer.
Choose your buffer radius by
typing in a distance measurement and selecting a unit of measurement.
Click Search to generate the buffer.
Buffer by Point
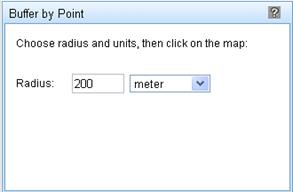
To buffer by a point on the map,
choose the desired radius and unit of measurement and then click on the
map. The tool will zoom to the
location and create the buffer.
Measurement Tools
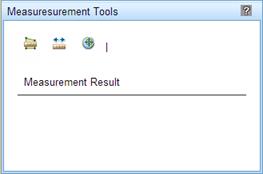
Click one of the tools to start
measuring. You will be able to select the distance and unit of measurement.
The Polygon Tool will measure the perimeter AND area of the object.
The Line Tool will measure the linear distance between locations.
The location tool will set a
point and identify the coordinates for that location in Degrees Minutes Seconds
or Decimal Degrees
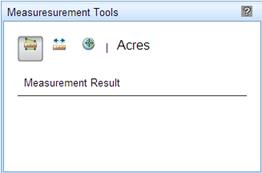
To use the measurement tools:
Click the appropriate tool to
select it.
Choose the measurement units from
the unit dropdown
Click on the map to create the
beginning and end points of the feature.
Polygons require at least three points, lines require two points.
Double-click the last point to complete the feature.
Once the feature is created, you
can change the units and the tool will update the final measurement to the
selected units.
Print Tool
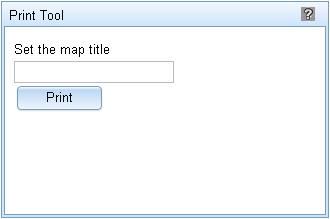
Choose a title for your map, and type
it in the box that says ��Set the map title.��
Click the Template button to choose the preferred page orientation and map
format. You can choose landscape or
portrait orientation.
Select an option from the
Template dropdown menu.
Once you have selected your map
template, the map will be generated and open in a new window. Make sure that you have the browser
pop-up blocker turned off, or set the browser so that it will allow pop-ups
from this site.
My Maps
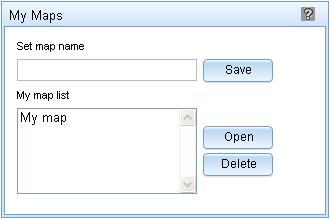
To use the My Maps tool, create a
map by adding layers from the Layers tool.
Then activate the My Maps tool by selecting it from the Tools menu.
Type in your preferred map name
in the ��Set map name�� box and click Save.
The newly saved map will show up
in the list under ��My map list��.
This list will be available to you in other tools like the Link Tools.
Notes:
��
This tool is
only available in IE9, Chrome, and Firefox.
��
Maps are
only saved during the current session. If the browser is closed and the cache
is cleared, saved maps will not be available.
Link Tools
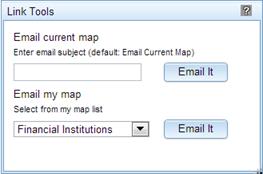
Use this tool to email a map to
another user. You must have an
email client installed (Outlook, etc.) for this function to work.
Email Current Map
��Email Current Map�� allows you to send a link to the map currently visible in
the browser to an email recipient.
To email your map, enter the
subject for the email and add whatever additional text you wish to add. Make sure that you do not change any of
the link text for the map. This
will render the link unusable.
Email My Map
To send one of your previously
saved maps, select the saved map from the drop down menu and click ��Email
It.�� The tool will open a new email
in your email application with the subject line set to the name of your map and
a link to the map that you have created.
You can edit the subject line, but do NOT edit the link text. You may add additional text in the body
of the email, separately from the link text.
Notes:
��
This tool is
only available in IE9, Chrome, and Firefox.
��
This tool
will only work if the browser cache has not been cleared.
��
When saving
maps for "Property Search", the boundaries/selection (highlighted in
yellow and orange for specific property) will NOT be displayed as a saved map. Email Current Map is recommended.
Location and Basemap Tool
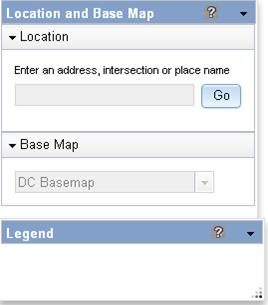
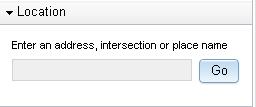 Location tool
Find a DC location
using one of the methods below:
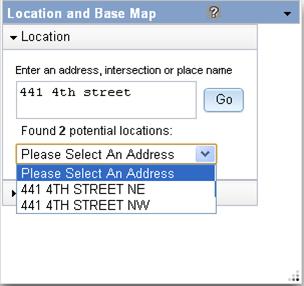
STREET ADDRESS:
For example, 441 4th
ST NW
 An address consists of a street number, a street name, and a
quadrant (NE, NW, SE, SW). The address number and
street name are required.
An address consists of a street number, a street name, and a
quadrant (NE, NW, SE, SW). The address number and
street name are required.
Type in the address
to search for and click ��Go��
The location tool
will attempt to find the address with as much information as you provide. If part of the address is missing and
there are multiple possible address matches, the tool will ask you to choose
from a list. Select the correct
address from the dropdown list.
INTERSECTION: An
Intersection search consists of two streets that either physically intersect or cross over
each other but are physically separated. Examples of how to format an
intersection search are:
��
14th
ST NW and Pennsylvania Avenue NW
��
14th
ST NW & Pennsylvania Avenue NW
��
16th
ST NW over Military RD NW
��
Military
RD NW under 16th ST NW
��
North
Capitol Street NE Northbound and ramp from Irving Street NE Eastbound
This search will
always find two possible intersections.
You will need to pick one to execute the search.
��
Type
in the appropriate set of streets and click Go to initiate the search.
��
Select
one of the two results to continue.
BLOCK: A block
consists of a street and any other cross streets.
��
4th
ST NW from D Street NW to E Street NW, or
��
400
Block of 4th St NW
Type in the
appropriate set of streets and click Go to initiate the search. Select one of the two results to
continue.
PLACE NAME: A place
name is typically the name of a well-known landmark, institution, or public
building name. Examples include:
��
"White
House"
��
"Dupont Circle��
��
"Wilson
Building��
��
��Wilson
High School"
��
"Woodrow
Wilson House"
Type in the
appropriate place name (without the quotes) and click Go
to initiate the search. Select one
of the results from the dropdown (if offered) to continue.
Basemaps
A base map is a map
that shows basic information about a place and provides the user with context
for the information that they are interested in learning about. A base map
typically only includes basic geographic data like political boundaries,
building footprints, water features, etc.
In DC Atlas, you can choose one of the following base maps by clicking
on the dropdown menu and highlighting one of the base maps:
��
DC
Basemap
��
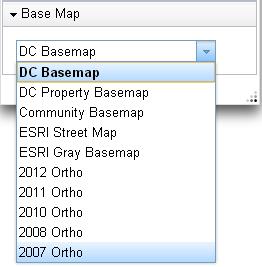 Community Basemap
��
ESRI
Street Map
��
ESRI
Gray Basemap
��
2012
Orthophoto
��
2011
Orthophoto
��
2010
Orthophoto
��
2008
Orthophoto
��
2007
Orthophoto
You can add
information to the base map by activating the Layers Tool and adding additional
data layers on top of it.
DC Basemap: uses DC GIS layers to create a detailed background
for adding a few, simple layers.
Community Basemap: A basemap developed for
ESRI, designed for community level mapping. This basemap
employs data layers from a variety of sources, including DC, Federal, and
private sector organizations.
Primarily focuses on building footprints, road polygons, and open space
features.
ESRI Street Map: This basemap was created by ESRI as a tool for maps around the
world. This basemap
includes highways, major roads, minor roads, one-way arrow indicators,
railways, water features, etc., overlaid on shaded relief for added context. The
map also includes building footprints for selected areas in the United States,
including the District of Columbia.
ESRI Gray Basemap: A base map designed
to feature data by using a neutral background with minimal colors, labels, and
features.
2007 - 2012 Orthophotos: An orthophoto is specialized aerial imagery that combines the
image characteristics of an aerial photograph with the geometric qualities of a
map. In an orthophoto, all ground features are shown
in their correct ground positions and can be used as a backdrop, or base map,
for other layers.
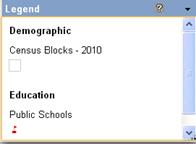
Legend Tool
The legend is the
description of the types of features included in a map, usually displayed in
the map layout. The legend in DC
Atlas Plus will be generated as you add layers to your map.
Changing the data
layers in the Layers Tool alters the appearance of the legend on your map.

Clear Map
The ��Clear Map�� button will clear
all data layers from your map.
Click the button to remove the layers. To replace layers you will need to add
them using the Layer Tool.
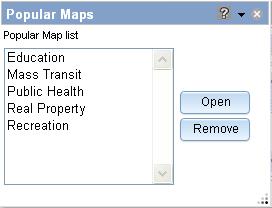
Popular Maps
��
Click on one
of the pre-designed maps to select it.
��
Click ��Open��
to activate the map and add the thematically-related layers to the map
area.
The remove button will remove all
of the layers from the map, similar to the ��Clear Map�� tool.
Clear Selection
The Clear Selection tool allows
you to clear selections made on the map using the following tools:
Property
Search
Identification
Buffer
Location
(search)
Once a
selection graphic has been added to the map using one of the above tools, click
on "Clear Selection" to remove the graphic and/or any accompanying
text from the map.
Identification Tool
The identification tool allows
you to work with data layers in the map, to provide information about
locations.
1. Start by using the DCGIS
Layers tool, and add at least one layer to the map 2. Click ��Identification�� on
the main toolbar to open the Identification tool.
3. On the identification dialog
box, check the box next to one or more layers from the ��visible layers list�� to
select the layer(s) for identification.
4. Choose a method of selecting a
feature on the map:
• By
Point (click on the map)
• By
Extent (left-click and drag a box around the features of interest)
• By
Polygon (create a multi-sided feature by left-clicking to create
vertices/corners of the polygon)
5. When you select a feature (or multiple
features), an Identify Results box will appear on the screen. It will list the features that were
identified. If more than one layer
was chosen for the identification operation, you will see each layer listed and
you can select the layer that you wish to review.
Help
The Help button will take you to
a web version of this document.
Full Screen
Click the
Full Screen button to expand the map
to the extent of your monitor��s viewable area.
Click the Exit Full Screen button to return to normal view.
Technical Assistance
For technical assistance, please
contact DC GIS at dcgis@dc.gov.